
Part Of: Causal Inference sequence
Content Summary: 1000 words, 10 min read.
A Riddle
We begin with a riddle!
We will arrive at an answer by the end of this article. 🙂 Our journey will begin with a survey of a field within visual processing.
The Mystery Of Stereopsis
Stereopsis is the computational construction of depth from visual data. Physics is embedded in three spatial dimensions, yet your retinae are essentially 2D (imagine wrapping a sheet of paper around half of a sphere). Depth information can be gleaned from comparing the disparities between two similar images, and applying geometric principles to compute depth. The dual images do not have to come from two eyes, either! Close one eye, and the brain can still infer depth from motion (by comparing two images from the same eye across time).
However, stereopsis is plagued by the problem of underdetermination. The following diagram motivates this nicely:

The inverse projection is your mental model of the environment. However, your brain only possesses 2D retinal images. To recreate the environment, we consider image matches:
- Gray hexes are matches (left image color does not match right color)
- White hexes are non-matches.
The grey hexes are possible 3D interpretations of the 2D images. The black hexes are correct 3D interpretation. The brain must select a subset of grey hexes to be black hexes (which possible interpretation is veridical). This is the visual inverse problem.
The Secret To Depth Reconstruction
Visual data alone provides no obvious solution to the visual inverse problem. How then do we explain interpretation consensus (that mammals almost always agree on one particular depth-interpretation), and interpretation veracity (that the consensus is almost always correct)?
Consider the inverse projection again. Do you notice that the black hexes (correct answers) tend to be side-by-side?
In general, we might prefer interpretations (grey hexes) that are spatially continuous. The brain in fact uses cues like spatial continuity to solve the visual inverse problem.
Spatial continuity helps us begin to understand interpretation consensus. But it alone is insufficient for selecting only one possible interpretations. The brain relies on a total of six cognitive assumptions:
- Existence Of Surfaces: The visible world can be regarded as being composed of smooth surfaces having reflectance functions whose spatial structure may be elaborate.
- Hierarchical Organization: A surface’s reflectance function is often generated by a number of different processes, each operating at a different scale.
- Similarity: The items generated on a given surface by a reflectance-generating process acting at a given scale tend to be more similar to one another in their size, local contrast, color, and spatial organization that to other items on that surface.
- Spatial Continuity: Markings generated on a surface by a single process are often spatially organized – they are arranged in curves or lines and possibly create more complex patterns.
- Continuity Of Discontinuities: The loci of discontinuities in depth or in surface orientation are smooth almost everywhere.
- Continuity Of Flow: If direction of motion is ever discontinuous at more than one point – along a line, for example – then an object boundary is present.
In his book, Marr shows how these assumptions can be expressed in computational algorithms that solve the visual inverse problem. Further, neurobiological evidence suggests that one of them is the actual mechanism used by our brains.
The Nature Of Cognitive Assumptions
Why do these cognitive assumptions work? Because Earth’s photic environment features important statistical regularities. We assume similarity because most within-object visual characteristics tends to be more homogenous than that between objects.
These six assumptions also explain many optical illusion phenomena. Most optical illusions represent statistical deviations that violate our reliance on the above assumptions. For example, the depth illusion at the beginning of the article violates our our brain’s natural intuitions about perspective. Such illusions therefore are not a misfiring of an individual human vision system. It is a design consequence.
How do our brains know about these statistical regularities? Two vehicles suggest themselves:
- Natural Selection. Since the world is rife with statistical regularities, organisms that encode this structure more efficiently will tend to outperform their peers.
- Developmental Learning. In addition to short-term episodes visual inference, the visual system might itself learn to retain information about statistical regularities. This is e.g., suggested in recent research on visual normalization.
If physics were different, the statistics of everyday vision would be different, and thus a different collection of cognitive assumptions would have emerged.
Crossing The Bridge To Causal Inference
Gopnik et al suggest that cognitive assumptions are not unique to vision. Causal inference also relies on statistical regularities of causations. Specifically, the following causal assumptions are relied on by the brain:
- Markov Assumption. If the conditional probability distribution of future states of the process (conditional on both past and present values) depends only upon the present state; that is, given the present, the future does not depend on the past.
- Faithfulness Assumption. In the joint distribution on the variables in the graph, all conditional independencies are consequences of the Markov assumption applied to the graph.
The Markov assumption says that there will be certain conditional independencies if the graph has a particular structure, the faithfulness assumption says that there will be those conditional independencies only if the graph has a particular structure. The faithfulness assumption supplies the other half of the biconditional.
Solving The Riddle
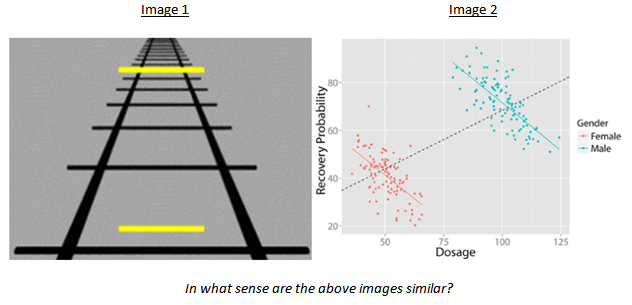
Statisticians have long known about Simpson’s Paradox: “a paradox in which a trend that appears in different groups of data disappears when these groups are combined, and the reverse trend appears for the aggregate data”.
Image 2 summarizes this effect well: only when you disaggregate gender can you see the deleterious effect of the drug on recovery probability.
These two figures are similar in virtue of the fact that they violate cognitive assumptions embedded in all neurotypical adults:
- Image 1 violate visual assumptions (perspective assumptions)
- Image 2 violate causal assumptions (faithfulness assumption)
References
- Marr (1982). Vision.
- Gopnik et al (2004). A Theory of Causal Learning in Children: Causal Maps and Bayes Nets
