
Part Of: Machine Learning sequence
Content Summary: 500 words, 5 min read
Motivations
Data scientists are in the business of answering questions with data. To do this, data is fed into prediction functions, which learn from the data, and use this knowledge to produce inferences.
Today we take an intuitive, non-mathematical look at two genres of prediction machine: regression and classification. Whereas these approaches may seem unrelated, we shall discover a deep symmetry lurking below the surface.
Introducing Regression
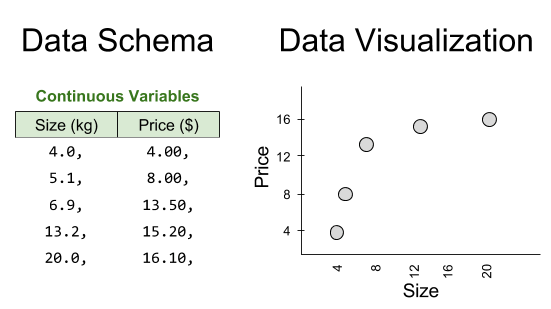
Consider a supermarket that has made five purchases of sugar from its supplier in the past. We therefore have access to five data points:
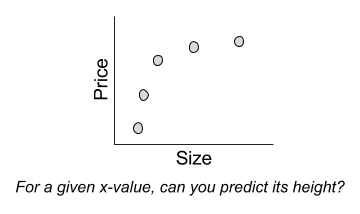
One of our competitors intends to buy 40kg of sugar. Can we predict the price they will pay?
This question can be interpreted visually as follows:
But there is another, more systematic way to interpret this request. We can differentiate training data (the five observations where we know the answer) versus test data (where we are given a subset of the relevant information, and asked to generate the rest):

A regression prediction machine will for any hypothetical x-value, predicts the corresponding y-value. Sound familiar? This is just a function. There are in fact many possible regression functions, of varying complexity:
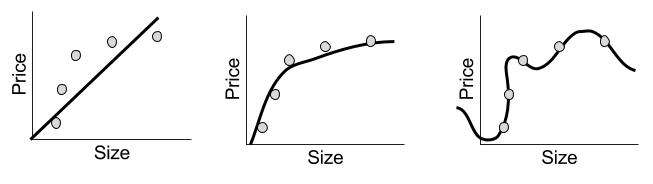
Despite their simple appearance, each line represents a complete prediction machine. Each one can, for any order size, generate a corresponding prediction of the price of sugar.
Introducing Classification
To illustrate classification, consider another example.
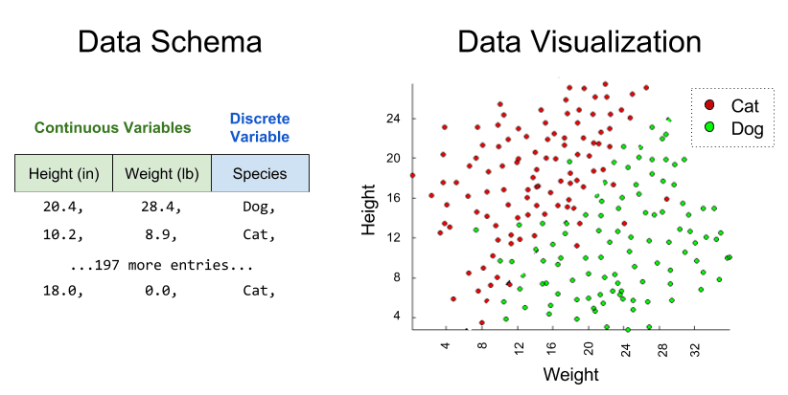
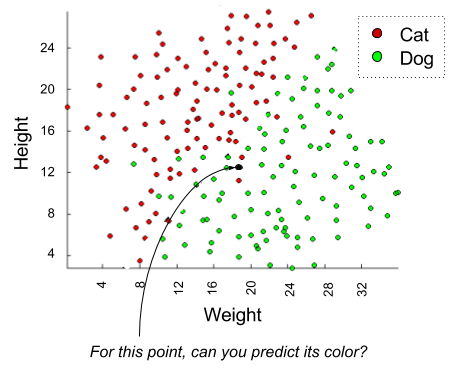
Suppose we are an animal shelter, responsible for rescuing stray dogs and cats. We have saved two hundred animals; for each, we record their height, weight, and species:
Suppose we are left a note that reads as follows:
I will be dropping off a stray tomorrow that is 19 lbs and about a foot tall.
A classification question might be: is this animal more likely to be a dog or a cat?
Visually, we can interpret the challenge as follows:
As before, we can understand this prediction problem as taking information gained from training data, to generate “missing” factors” from test data:

To actually build a classification machine, we must specify a region-color map, such as the following:
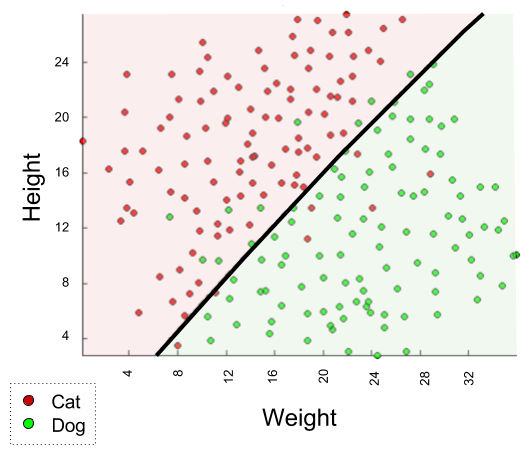
Indeed, the above solution is complete: we can produce a color (species) label for any new observation, based on whether it lies above or below our line.
But other solutions exist. Consider, for example, a rather different kind of map: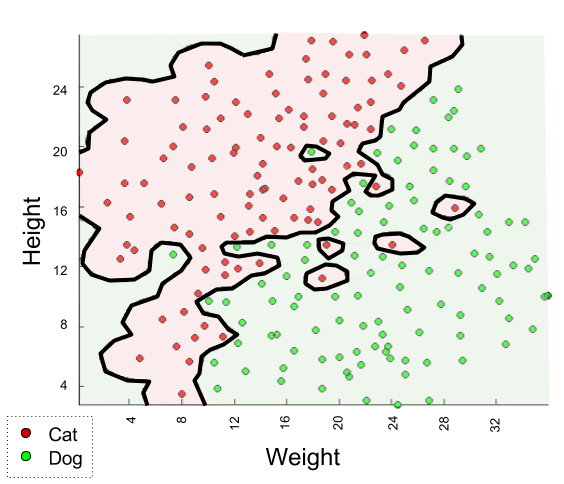
We could use either map to generate predictions. Which one is better? We will explore such questions next time.
Comparing Prediction Methods
Let’s compare our classification and regression models. In what sense are they the same?

If you’re like me, it is hard to identify similarities. But insight is obtained when you compare the underlying schemas:

Here we see that our regression example was 2D, but our classification example was 3D. It would be easier to compare these models if we removed a dimension from the classification example.
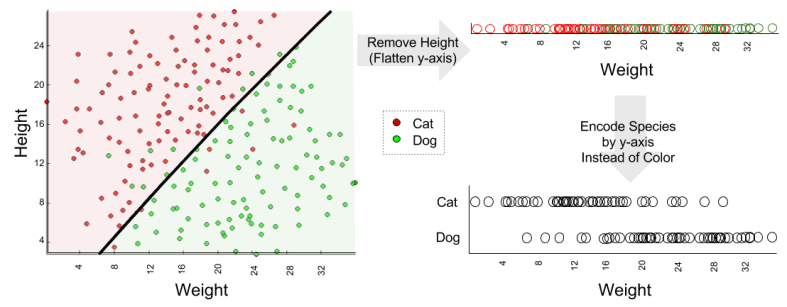
With this simplification, we can directly compare regression and classification:
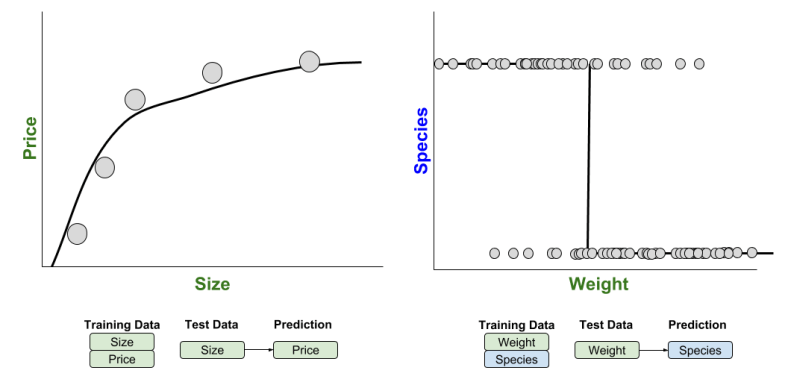
Thus, the only real difference between regression and classification is whether the prediction (the dependent variable) is continuous or discrete.
Until next time.
